
Trade shows are a powerful platform for brand visibility, lead generation, and relationship building. But they also come with a significant investment. According to the Center for Exhibition Industry Research (CEIR), companies allocate an average of 31.6% of their B2B marketing budget to events. With that kind of spend, leadership expects more than a great-looking booth – they want measurable outcomes. The challenge? Calculating ROI from trade shows isn’t always straightforward.
Let’s break down how to measure the return on investment (ROI) from trade shows, the key metrics to track, and how event managers can tell a compelling story that earns continued support from leadership.
What is Trade Show ROI?
At its simplest, ROI = (Return – Investment) ÷ Investment. But in the world of trade shows, especially in industries with longer sales cycles, “Return” might not mean immediate sales. It could include leads generated, partnerships formed, press mentions, or brand awareness. That’s why it’s crucial to define success before the show and use the right KPIs to track your impact.
Defining Success
I have mentioned in previous articles the importance of setting event objectives before the show and defining success. So, what might that look like? I recommend creating a marketing strategy document that lists out the following:
1. Show Objectives – These should be SMART (Specific, Measurable, Attainable, Relevant, and Timely). Make the goals clear and decide which KPIs you will use to measure against the objective along with the strategies you will use to collect that data. This section can be a chart to make it easier to read.
2. Show Theme/Tagline – Even if you are using your brand tagline rather than a specific show theme or tagline, you should include this in your document. Every branded element should tie back to that theme or tagline, which hopefully helps you achieve your objectives. Your main message should be one key phrase that captures what you want visitors to remember about your company. Make sure everything at your booth – from signs to conversations – reinforces this same message.
3. Engagement Strategies – From interactives, demos, and presentations to survey collection and swag, write down your booth engagement strategies. Also map out the path you want people to take through your booth – where they’ll enter, what they’ll see first, and how they’ll move around. After the show, you can compare what actually happened to what you planned.
4. External Traffic Drivers – List in your document all the ways you’re promoting the show: social media posts, email campaigns, website updates, invitations sent to customers, and any press releases. This helps you track what’s driving people to your booth.
Key Metrics to Measure
Here are the most critical metrics for calculating and demonstrating ROI:
1. Number of Qualified Leads
- Why it matters: More than 80% of trade show attendees have buying authority (CEIR).
- How to measure: Use lead scanning tools, CRM integrations, or apps that categorize leads by type (cold, warm, hot).
- Bonus: Compare the cost per lead at the trade show to your average lead acquisition cost from digital or sales efforts.
Qualified Leads does not mean Quality Leads or Hot Leads. Qualified leads are simply those that have been sorted onsite based on information you’ve collected about that person and their purchasing interest. Separately, you’ll want to look at how many hot, warm, and cool leads you collected, which means the definitions of those temperatures will have to be defined in advance. Understanding what the sales team needs from the attendee to qualify them as a hot lead is critical to your lead generation efforts onsite.
2. Conversion Rate
- Why it matters: It helps you measure how effective your booth staff and follow-up efforts were.
- How to calculate: Conversion Rate = (Number of Leads that Convert to Customers ÷ Total Leads Collected) × 100
Your brand may not define a conversion as a sale. A conversion might be taking a sales call or visiting the website after an email follow-up, so be clear on terminology and their definitions when reporting this information.
3. Sales Revenue Attributed to the Show
- Why it matters: It’s the most direct indicator of financial ROI.
- How to calculate: Track sales that can be directly linked to leads from the trade show over a defined time window (e.g., 6–12 months post-show).
We all have a love/hate relationship with this metric because many times it’s the only data leadership will look at. Impress upon your leadership team the need for reasonable follow-up time windows. It can be very difficult for some to believe that a sale that occurs eight months after the show came from the show. Fight for a CRM system that attributes leads to an event and educate your leadership team about the time it takes for follow-up, proposals, negotiations, and sales.
4. Cost Per Lead (CPL)
- Why it matters: Helps compare the efficiency of trade show efforts to other channels and other trade shows.
- How to calculate: CPL = Total Trade Show Investment ÷ Number of Leads Collected
Note that you may have a much higher cost per lead in the event space, but the attendees may be far more qualified than the user receiving one of your digital ads. There is value in having all of your potential buyers in one room at the same time that you do not get with other channels. In fact, many companies find trade show leads are more valuable because of the face-to-face interaction and immediate relationship building that happens at shows, even if the cost per lead is greater.
5. Brand Engagement Metrics
- Examples: Website traffic spikes, social media engagement, hashtag usage, or content downloads during and after the event help determine brand engagement effectiveness.
- Tools: Use platforms like Google Analytics, Sprout Social, or HubSpot to track these metrics.
6. Meeting Metrics
- Why it matters: Pre-booked meetings often lead to higher close rates.
- How to measure: Count the number of scheduled meetings with prospects, partners, or press. Include meeting outcomes if available. You can do this with demos as well. Count how many demos you’ve had, how many of them have follow-up meetings, and approximately how long each demo took.
7. Booth Traffic and Dwell Time
- Tools: Heat mapping cameras, RFID tracking, AI facial recognition, cellular beacons, or mobile event apps.
- Insight: High booth dwell time can indicate strong engagement with your experience or message.
Not everyone has the budget to employ booth traffic tracking devices. If your budget is limited, there are other ways to track dwell times. For example, you can time the duration of different activities in your booth. How long does each demo take? How about in-booth presentations, games, or surveys? How many attendees participated in these experiences? Knowing this information can give you some data about your booth traffic and dwell times without having to install additional tracking devices.
Calculating ROI in Real Terms
Let’s say your company spent $100,000 on a trade show. You generated 300 leads, 50 of which converted into customers, producing $400,000 in revenue over the following six months.
Your ROI formula would look like this:
ROI = ($400,000 – $100,000) ÷ $100,000 = 3.0 or 300%
That’s a great return. But what if you didn’t close many deals yet? Then focus on other value metrics like pipeline value (total dollar amount of potential deals in your sales pipeline), average deal size (how much each potential deal is worth), or cost per qualified lead (what you paid for each serious prospect). These numbers still show your trade show was worthwhile, even before deals actually close.
Proving Value to Leadership with Data + Storytelling
Data alone doesn’t always move the needle—context is everything. Leadership doesn’t just want spreadsheets; they want to understand impact. Here’s how to bridge that gap:
1. Start with Business Objectives
Once again, the objectives are pivotal. Tie event performance back to business goals: growth, pipeline development, market expansion, or brand elevation.
2. Visualize Your Metrics
Use graphs, heatmaps, and dashboards to make data digestible. Include year-over-year comparisons if possible.
3. Tell the Story Behind the Numbers
Metrics show what happened. Storytelling explains why it mattered. For example: “We didn’t just scan 300 badges – we had meaningful conversations with 80 decision-makers in our target industry, resulting in $1.2M of new pipeline opportunities. That’s more qualified reach in three days than three months of outbound.”
Also, consider capturing attendee sentiment about the brand through surveying, video reels, testimonials, and booth engagement photos.
4. Look Beyond the Numbers for Unexpected Wins
Did your CEO get interviewed by a trade publication? Did you have a breakthrough conversation with a major prospect? Ask your booth team what surprised them or got them excited about future opportunities. These intangibles create value beyond what numbers can show.
Final Thoughts
Measuring trade show ROI isn’t about checking boxes – it’s about demonstrating the business impact of live experiences. When you combine hard data with smart storytelling, you don’t just justify your event spend – you champion it.
So next time you’re preparing that post-show recap for leadership, don’t just report the numbers. Translate them into insight, meaning, and momentum. That’s how you move from event manager to strategic driver of growth.

TPG’s CEO, Christina Piedlow
Post-Show ROI Report Template
Event Overview
- Event Name:
- Date/Location:
- Booth Size/Type:
- Total Investment: $_______ (Include booth space, travel, build, promotions, shipping, staffing, giveaways, etc.)
- Team Attendees:
- Event Objectives: (e.g., Generate qualified leads, launch new product, build brand awareness, meet with partners)
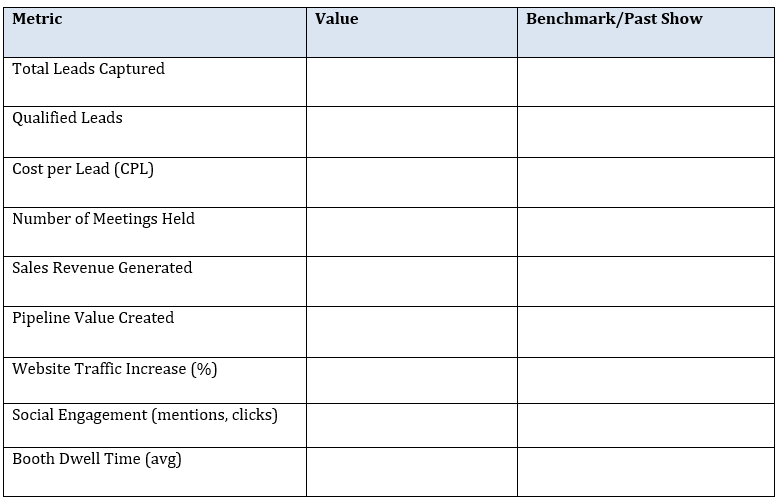
Key Performance Metrics
ROI Summary
- Revenue Attributed to Event: $ _______
- Pipeline Opportunity Created: $ _______
- ROI Formula: (Return – Investment) ÷ Investment
- Calculated ROI: _______%
Strategic Wins & Insights
Use bullet points or short paragraphs to highlight value that goes beyond numbers:
- Met with X high-value prospects, including [names/titles/companies]
- Gained exposure through [press coverage, influencer visit, social buzz]
- Feedback from booth visitors indicated strong interest in [product/service]
- Notable competitor intelligence gathered
- Engaged new audience segment (e.g., international, Gen Z buyers, etc.)
Lessons Learned
- What worked well? Then compare to previous years if applicable.
- What could be improved next time?
- Were there any surprises (good or bad)? Compare to previous years if applicable.
- What does the data from the show tell you about your overall investment? Is this show worth reinvesting next year and why? At what level should the brand reinvest for next year?
️ Leadership Summary Slide
One-slide Story Recap:
“At [event], we engaged with [X] qualified prospects, generating [Y] in new pipeline and closing [Z] in sales to date. With a [W]% ROI, the event outperformed [benchmark or previous year]. Notably, we met with [key partners/leads] and amplified our brand presence across [channel], proving trade shows remain a high-impact channel for our growth.”
If you want to learn more about why measuring ROI at trade shows is so important and how doing it right can really make a difference, check this out and contact us! Analytics + Measurement for Trade Shows – TPG Trade Show + Event Marketing